Holdings Unification

Project length
5 months
My role
UX Designer
Problem area
Morgan Stanley purchased E*TRADE in 2020. Since then, we’ve been working to unify the two platforms. As a part of that effort, we set out to unify the most complex experience on each platform; Holdings.
Solution
A single unified solution that is flexible enough to integrate the best of both pre-existing platforms, resulting in a product that all user groups would feel comfortable interacting with while adhering to all technical requirements.
Define
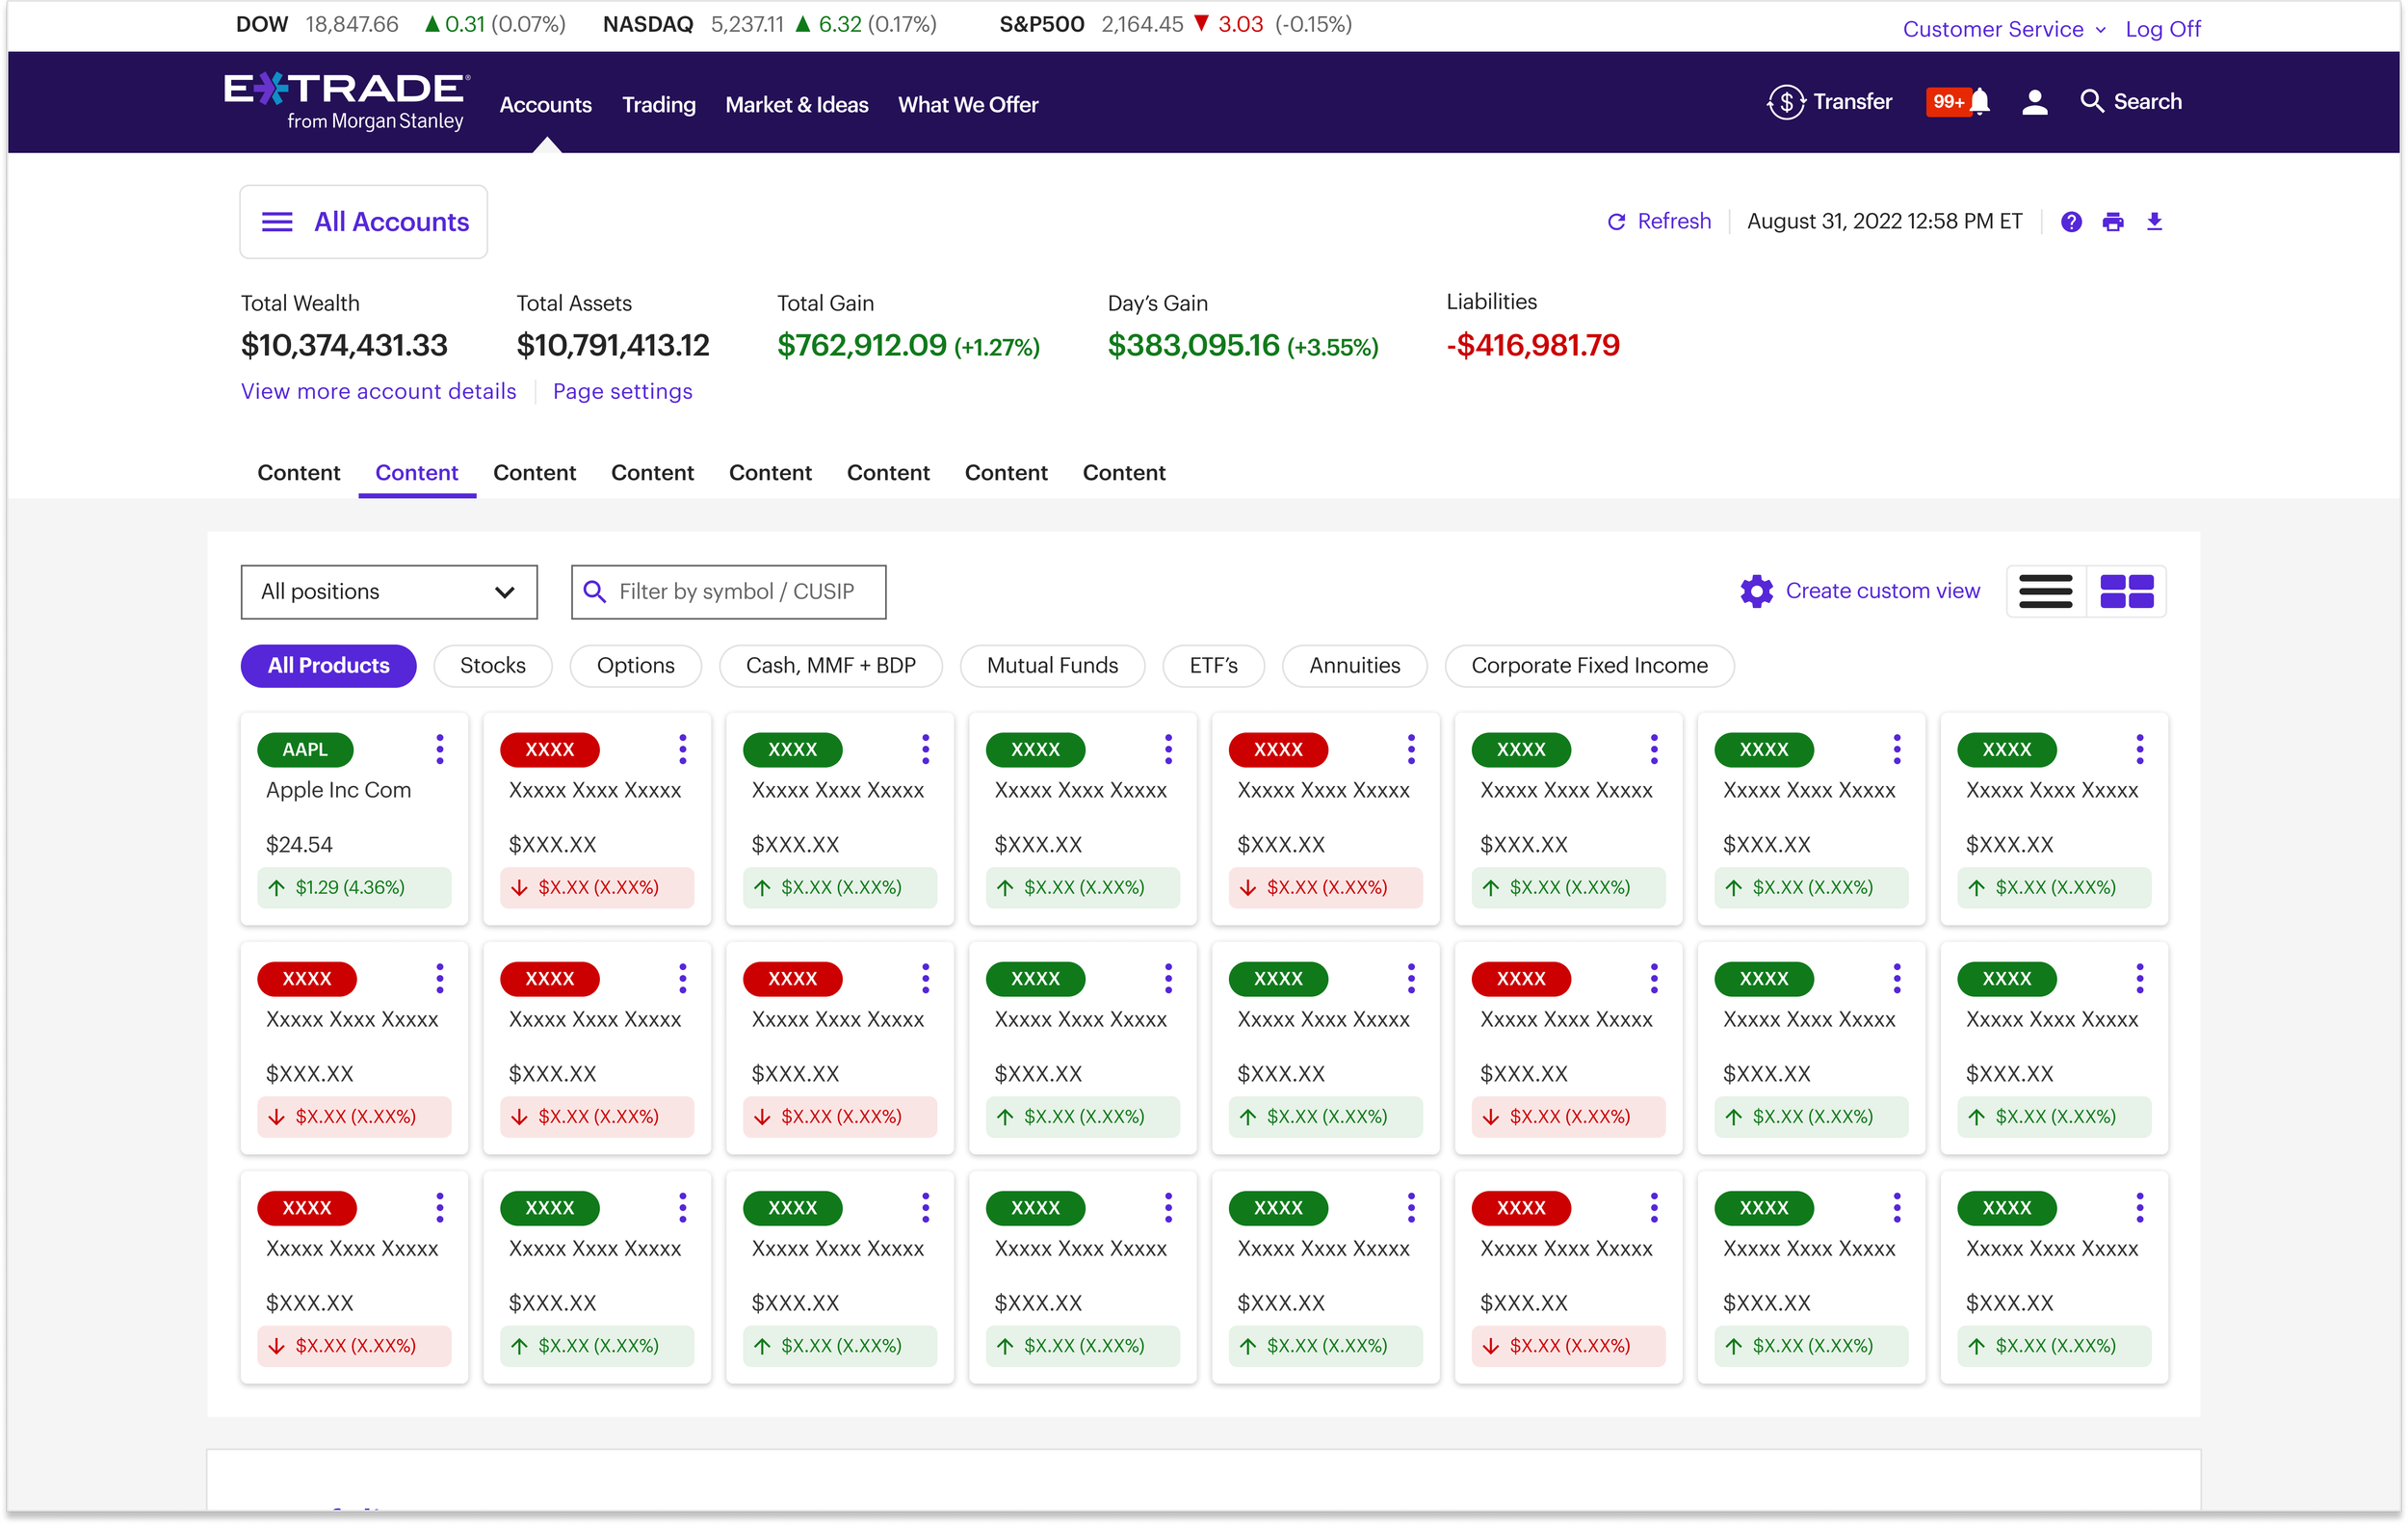
The product
Morgan Stanley Online is a client facing financial tool that helps wealthy clients work with their dedicated Financial Advisors to manage their complex portfolios, often investing in 30+ different security types.
Conversely, E*TRADE.com primarily services self-directed clients with Brokerage accounts looking to engage in active trading of stocks and options.


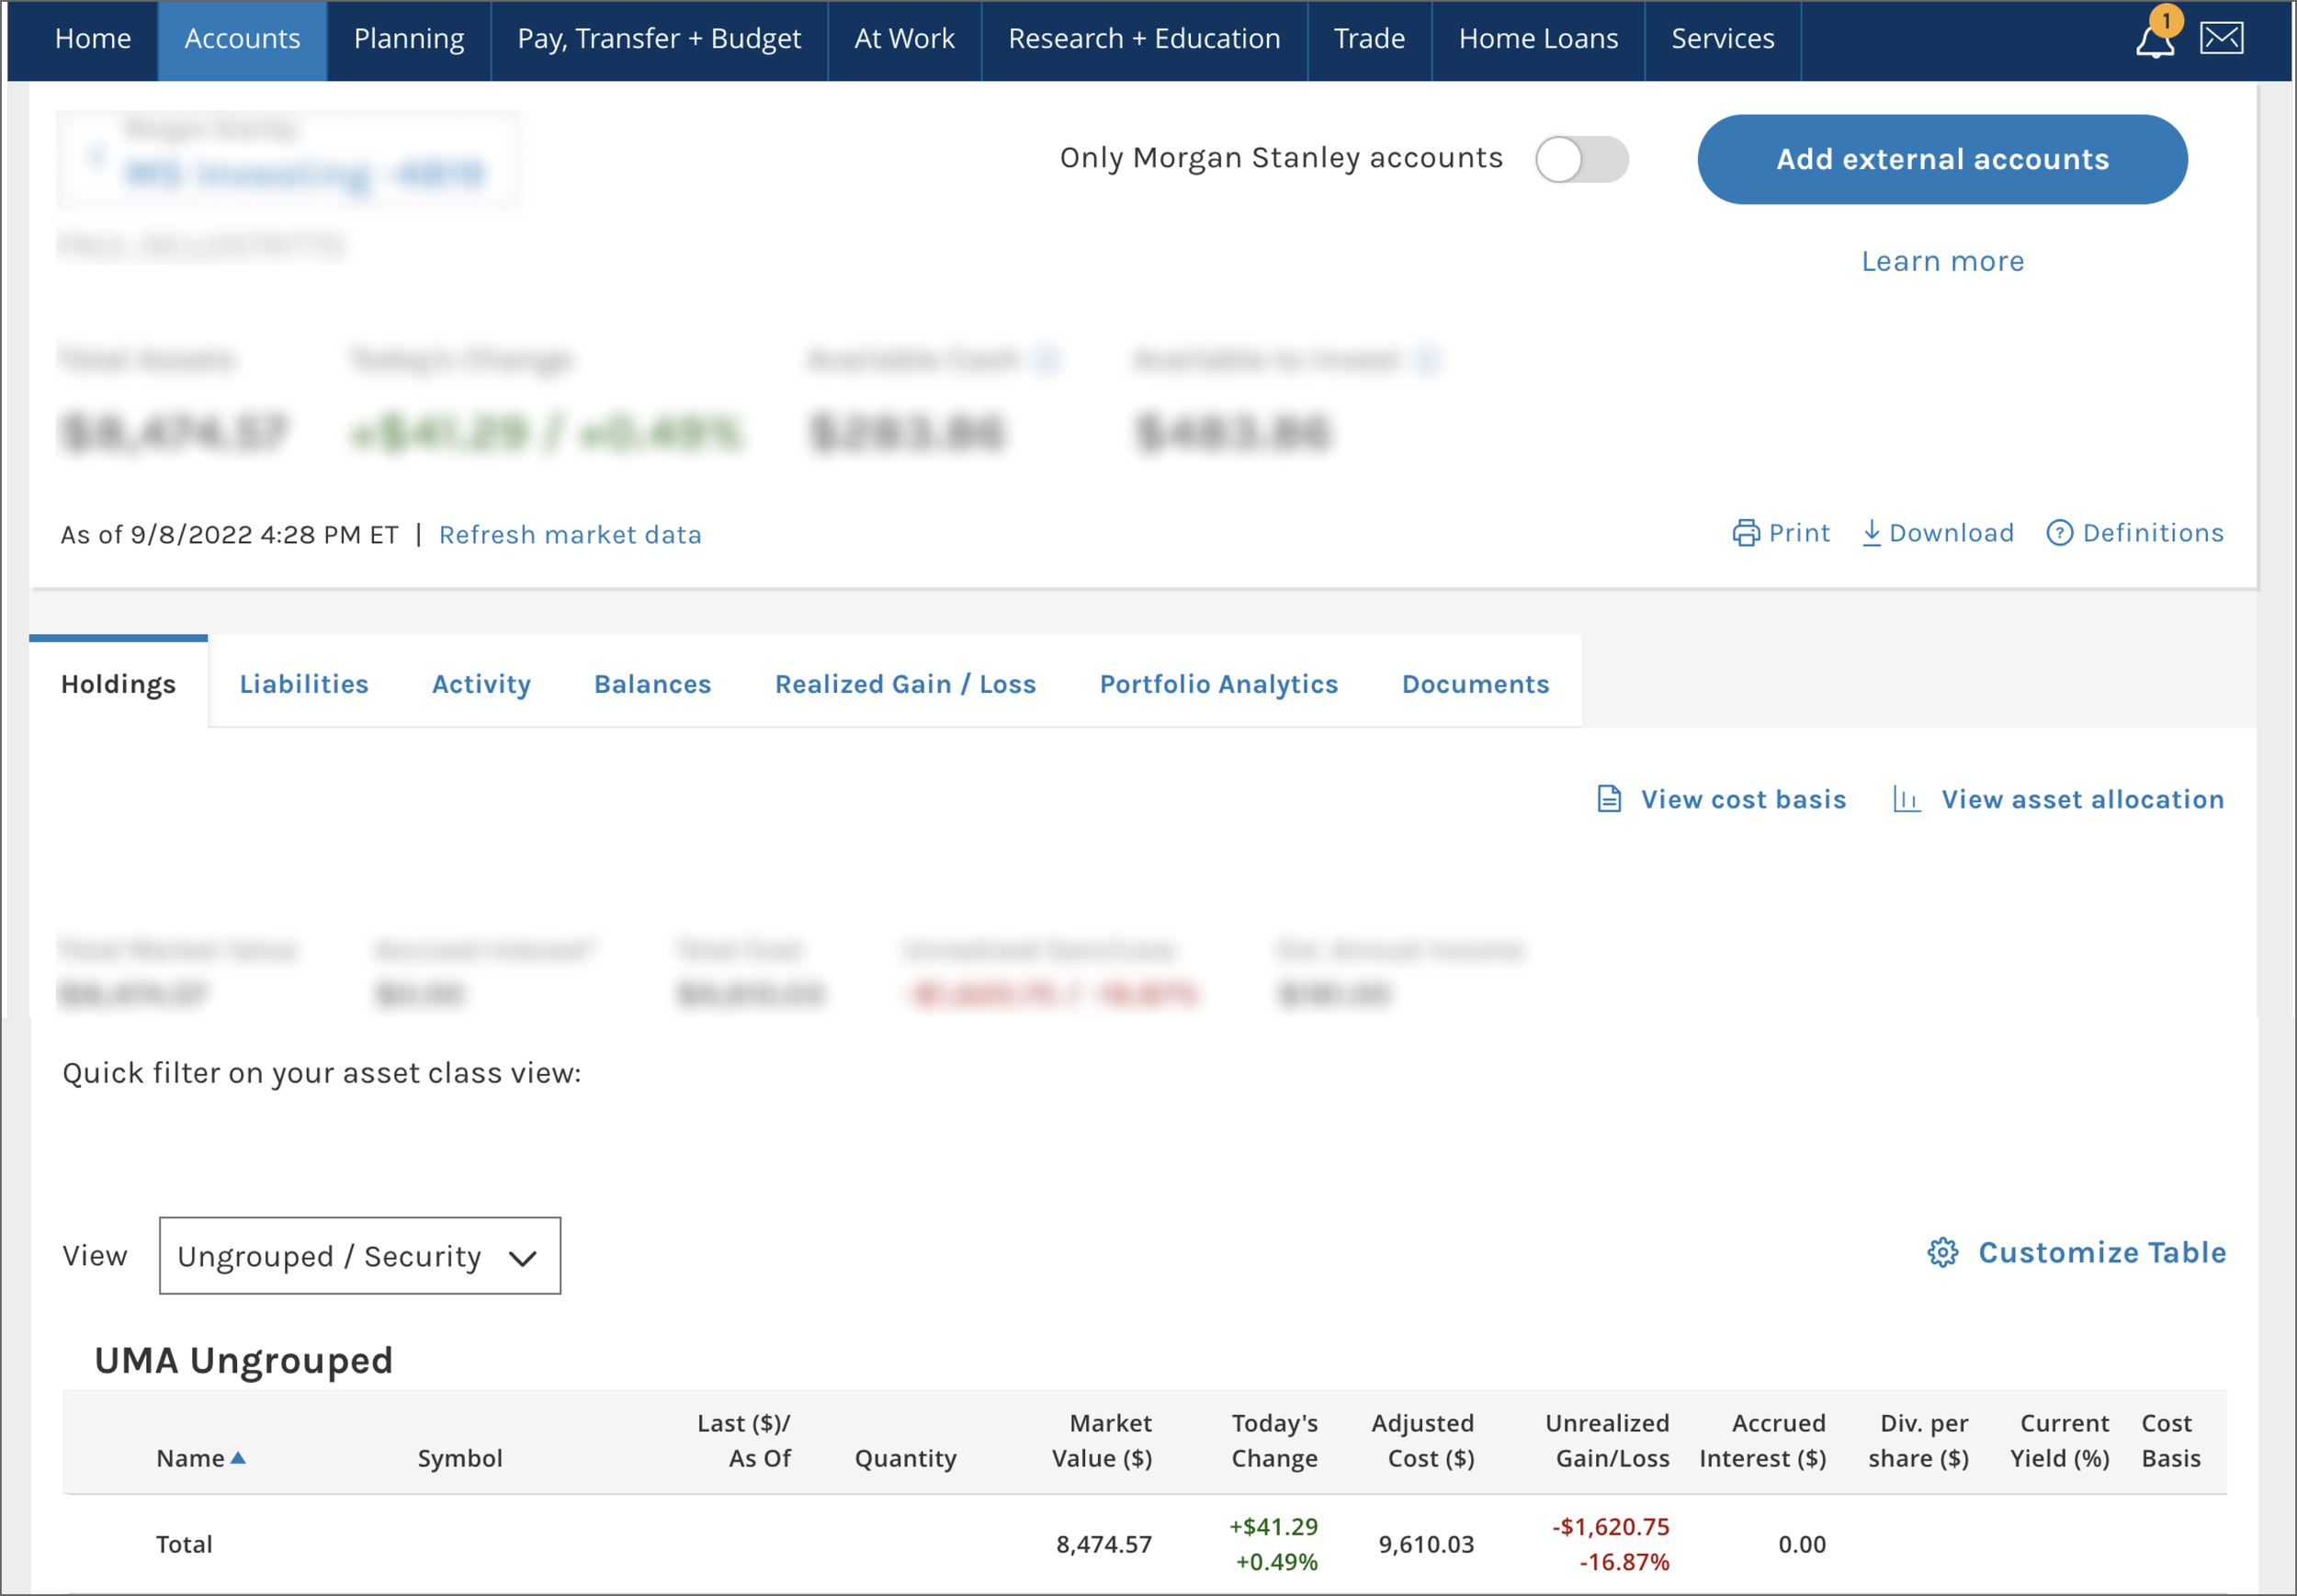
The experience
Holdings is the 2nd most trafficked page on the platform. It allows users to view details regarding their individual positions, offering robust customization and sorting features that suit the differentiated needs of all investors.

The strategic approach
Problem area(s)
The MSO and ET experiences are very different with their own respective patterns, requirements and levels of functionality.
Technical limitations hinder our ability to consolidate all Holdings data into one view.
Design strategy
Create a ‘best of both worlds’ solution that takes the best features from both MSO and ET.com and combines them into a single product.
Offload data that isn’t pertinent to the user’s day to day workflow.
Allow for customization that would bring this data to the default view.
Design
Design approach
Given this experience was particularly complex, we decided to simplify the design process by breaking it down into three manageable feature sets.
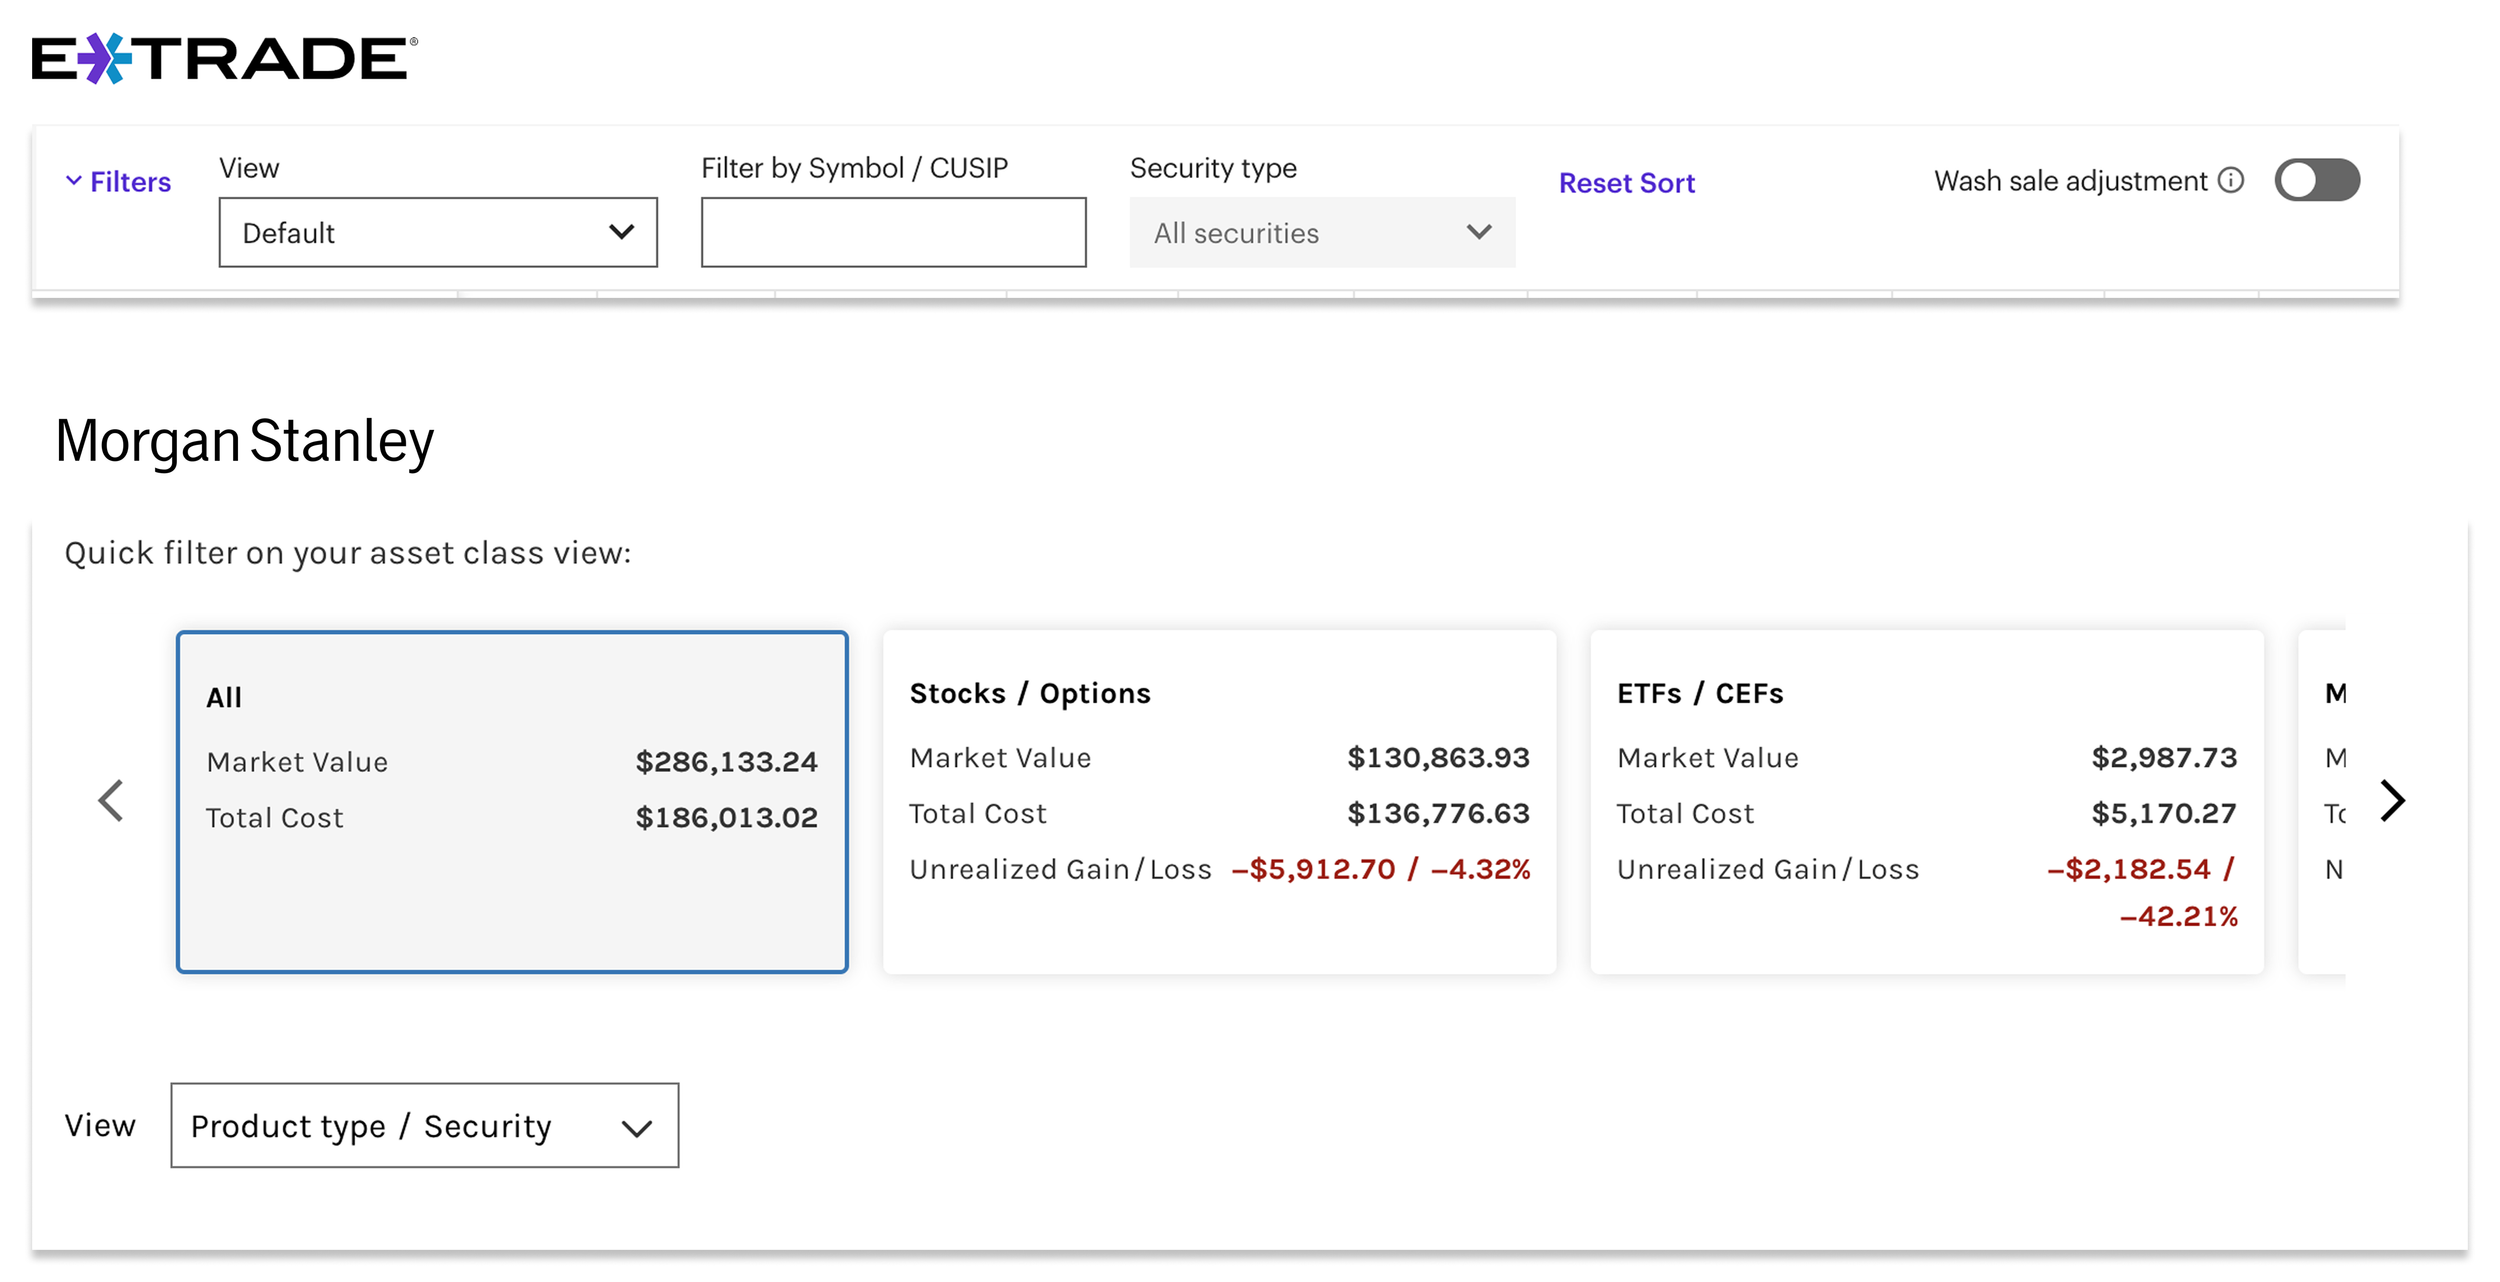
Sort + Filter
Customize
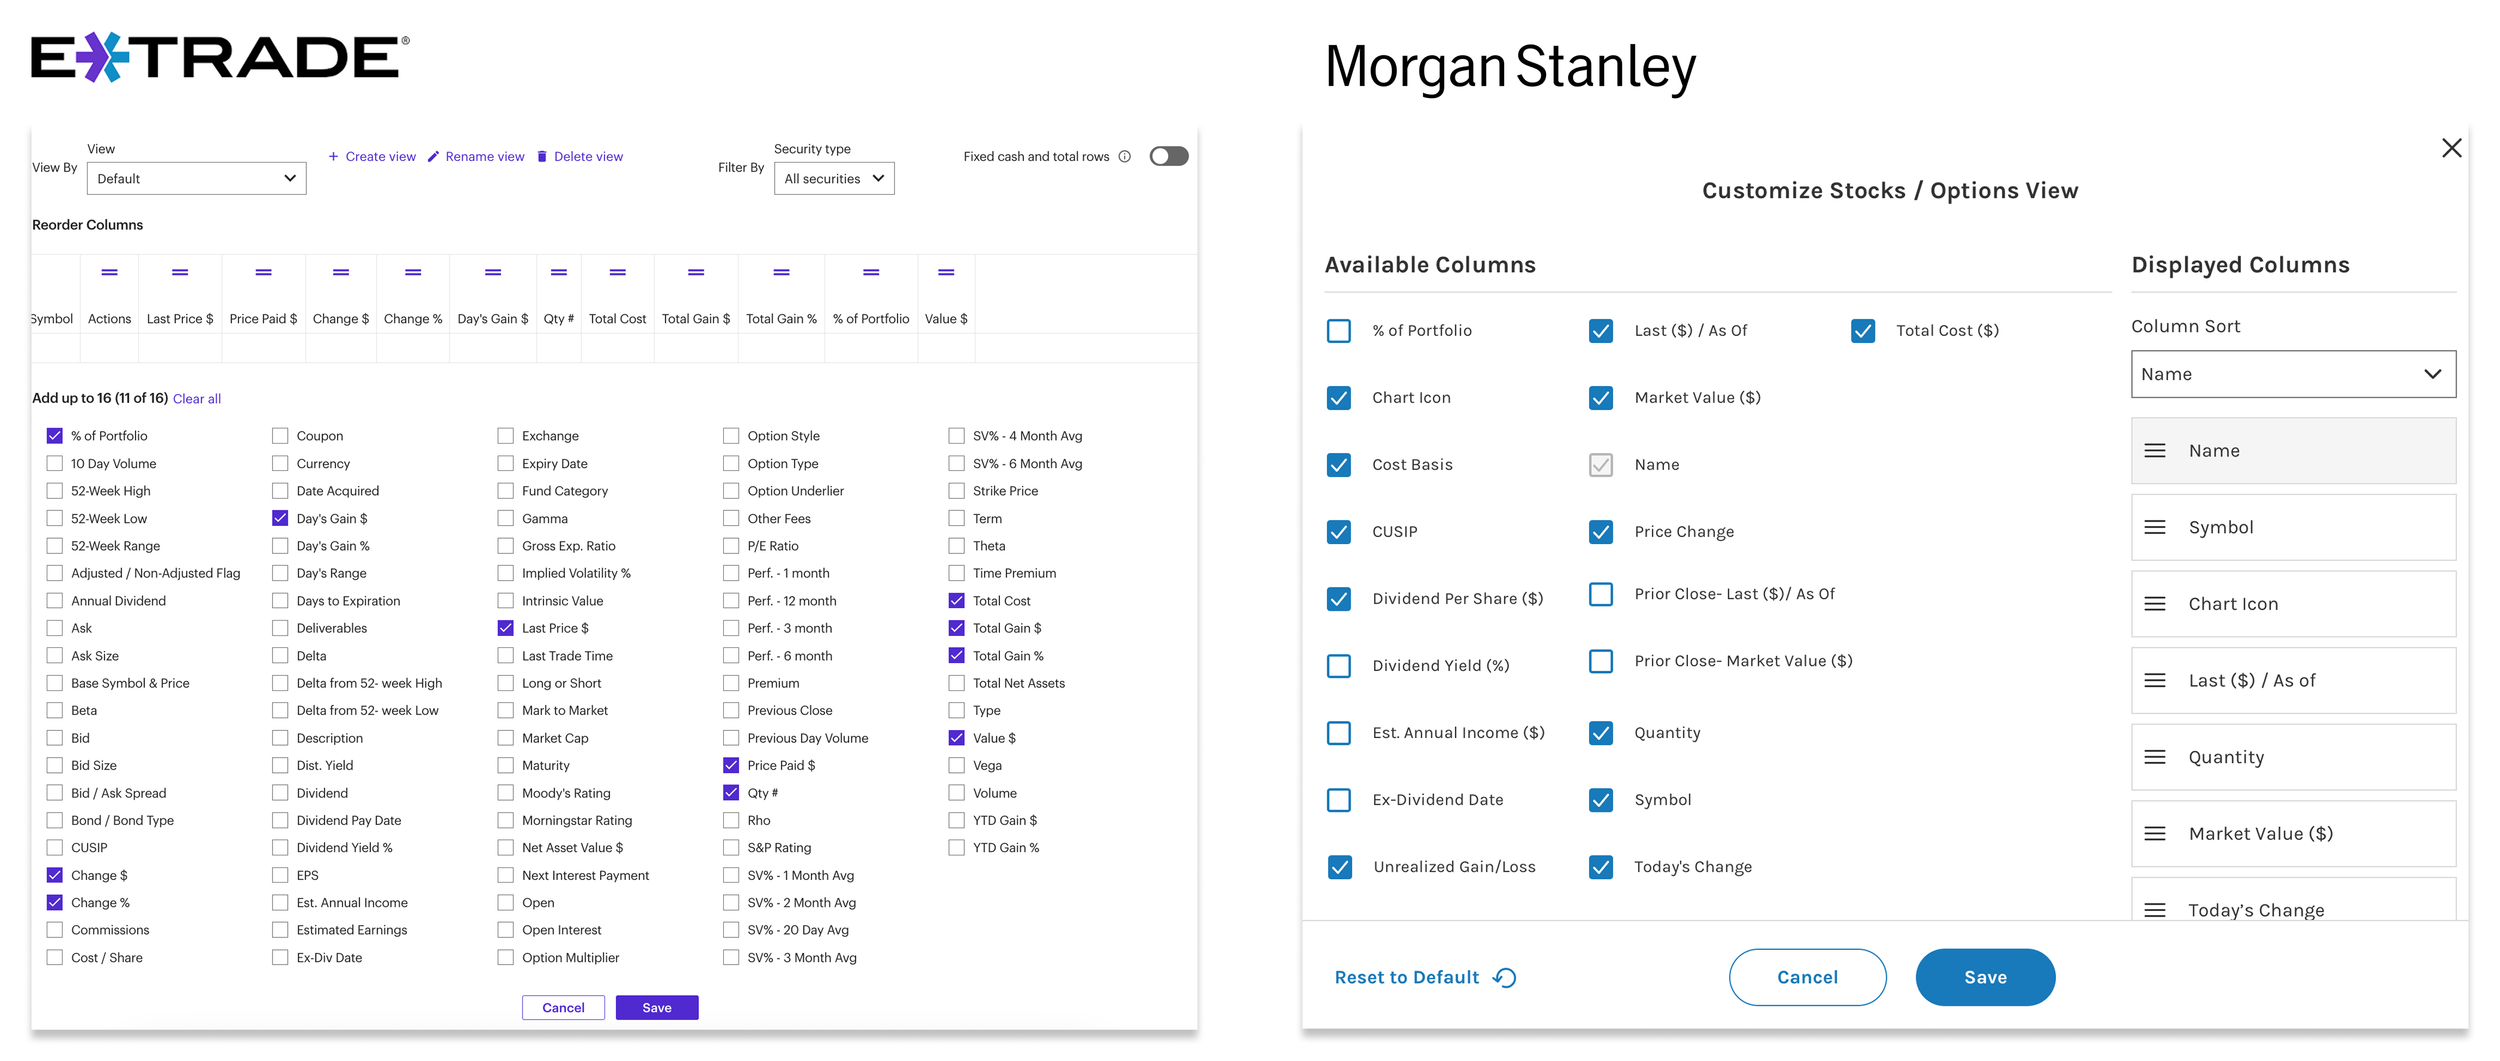
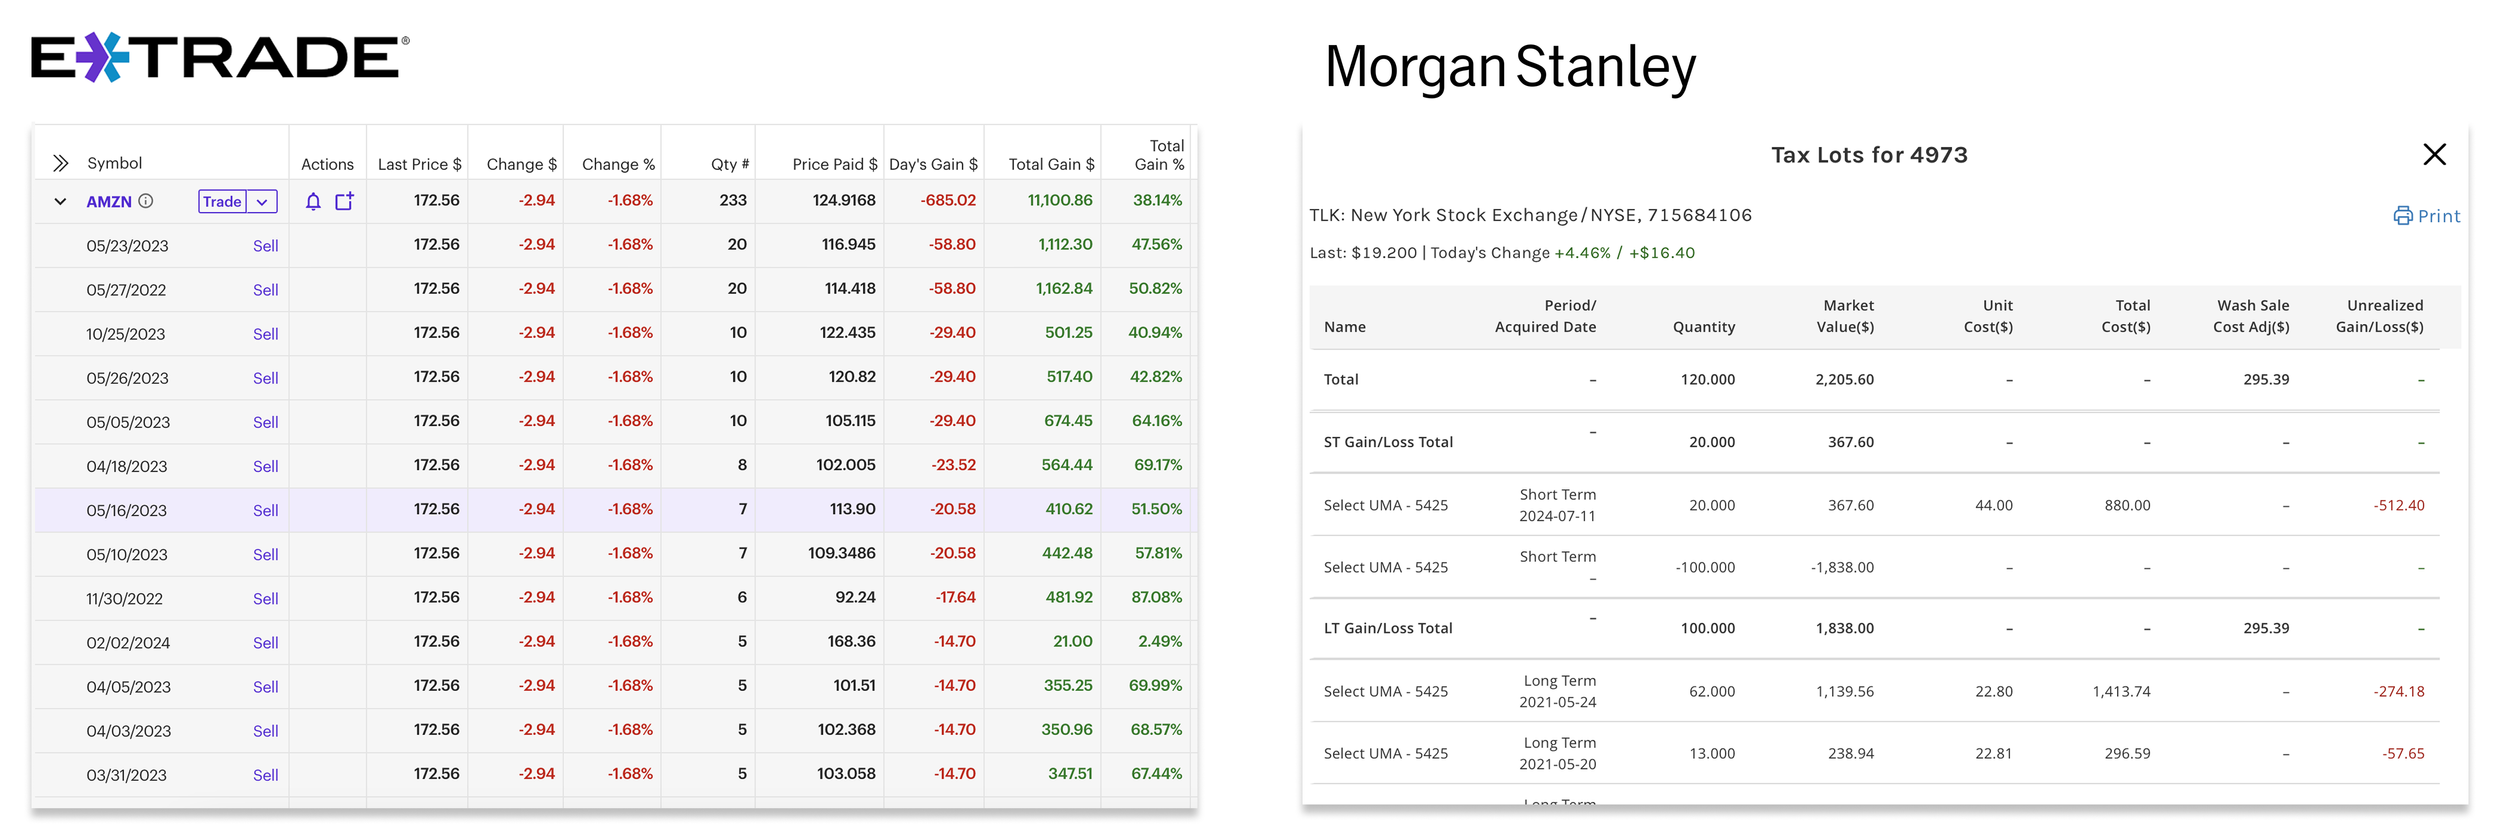
Table nesting + organization
Competitive analysis
Sort + Filter
Competitors
Chase, Fidelity, Charles Schwab, Citi Bank
Takeaways
No clear consensus. Approaches vary from a search filter, pre-defined sorting options tailored to specific asset types, turning lot data on and off, etc.
Customize
Competitors
UBS, Charles Schwab, Fidelity
Takeaways
Competitors primarily focused on giving users the ability to reorder and add/remove columns. None actually provided the opportunity to save these views for future reference, or include any filter functionality.
Table nesting + organization
Competitors
Wealthfront, Chase, Fidelity
Takeaways
Competitors rarely introduced more than 1 layer of nesting while offloading supplementary information, such as ex-dividend dates, to minimalistic affordances or modals.
Design challenges & solutions
Sort + Filter
Requirements
Enable users to filter by product type, filter by symbol/CUSIP, sort by standard views, and sort by custom views.
Challenges
1. The standard views vary drastically between the two platforms.
2. MS has a more visual and robust product type filter that incorporates data, while ET uses a dropdown.
3. ET dynamically updates columns based on sort selection, while MS does not.
Solutions
1. Use the ET standard views as a default. Fill this gap for MS clients by creating a customize experience that allows them to recreate the standard views they’re accustomed to if need be.
2. Condense the MS product type filters into single-select pills. These allow for visual access to product filtering while removing redundant data and salvaging vertical space on the interface.
3. Dynamically update the table columns based on product type selection, this is net new for MS clients.

Customize
Requirements
Enable users to customize the Holdings table to suit their needs.
Challenges
1. ET currently has a more complicated and robust customization experience, allowing clients to create and save custom views based on sorting, filtering product types, reordering columns and removing/adding columns altogether.
2. MS only allows clients to edit the table by reordering columns and adding/removing a select few. These edits are simply applied to the current interface and are not saved or easily accessed if the client logs out.
Solutions
Implement both the ET and MS patterns:
1. Offer a more robust custom view creation experience (similar to ET) by click the ‘create custom view link’. Users can then save and easily access this view moving forward.
2. Allow clients to edit their current view (similar to MS) by clicking the ellipses on the table
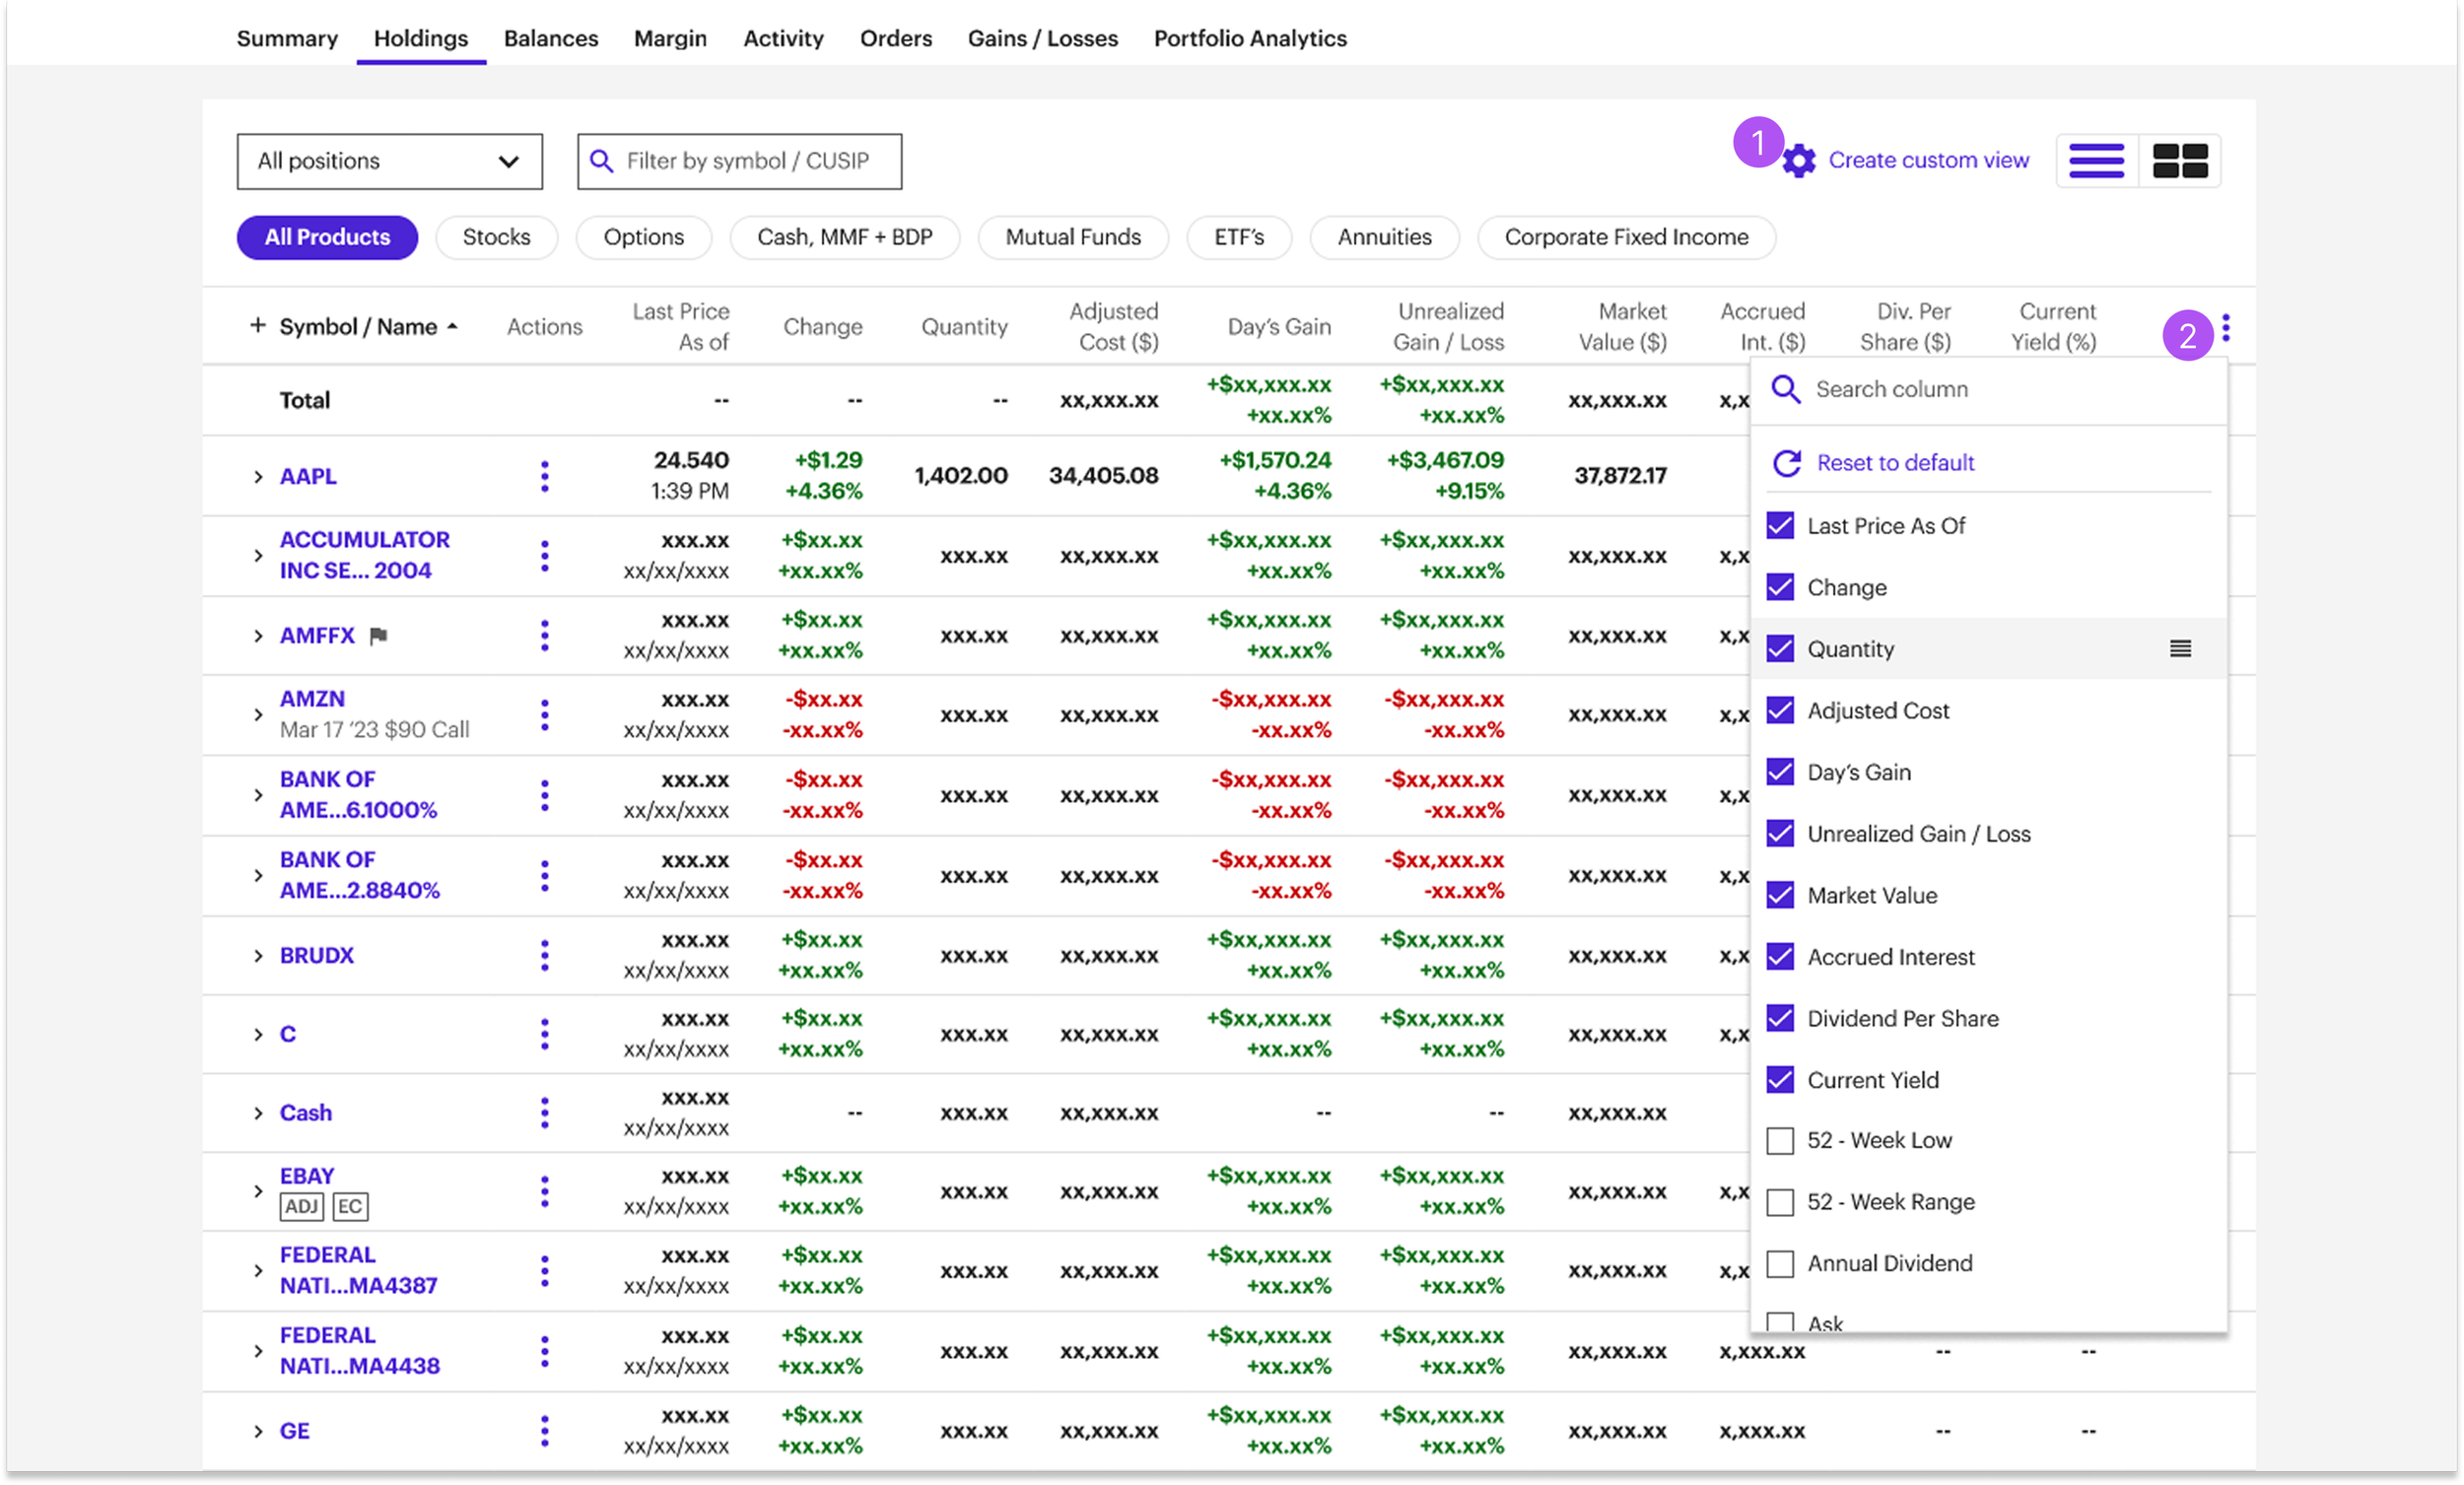

Table nesting + organization
Requirements
Create a table that can scale to account for all product/symbol types, elevates actions, is built on a single grid, can scale, is not too dense to load, and notifies the users of various events, such as ex-dividend dates.
Challenges
1. Certain asset classes, such as annuities, can consist of 50+ characters.
2. MS sporadically places their alerts across the row, while ET consolidates them in a single icon.
3. ET’s total row is on the bottom while MS is on top.
4. ET has 1 datapoint per column while MS stacks 2 at a time and uses 4 way sorting.
5. ET allows for only 1 level of nesting, while MS allows for 3.
6. Each product organizes their columns in a different order.
7. The entire page will crash if the table is too dense.
Solutions
1. Use middle truncation in order to limit lengthy symbol names to just 2 lines.
2. Use badges to consolidate all symbol level alerts to the left most cell.
3. Move the total row to the top to align with MS, as this is something ET clients have previously complained about.
4. Stack columns when necessary and implement 4 way sorting.
5. Limit nesting to just 2 levels in order to minimize load times while meeting the client’s basic needs.
6. Default to MS column ordering, as clients can seamlessly reorder to their liking as shown above.
7. Offload content by using pagination.

Secondary experiences


User Research
Study format
Unmoderated usability test
Participant details
13 participants (8 ET clients, 3 MS clients, 2 dual)
Tasks
Participants were asked to locate their tax lot information, filter the table by product type, create a custom view, buy/sell a position, and view the quote snapshot of a position.
Results
The test was mostly successful, as 10/13 participants reporting the tasks were ‘very easy’ to complete.
That said, the results helped inform a few key updates:


Mobile design
We approached Mobile with the goal of maximizing functionality while limiting clutter and cognitive load.
One of the ways we achieved this was be creating a ‘compact’ and ‘expanded’ view of the table. The compact view would closely align with our existing ET Holdings table, while the expanded view would provide in-depth information that met the niche needs of HNW Morgan Stanley clients.

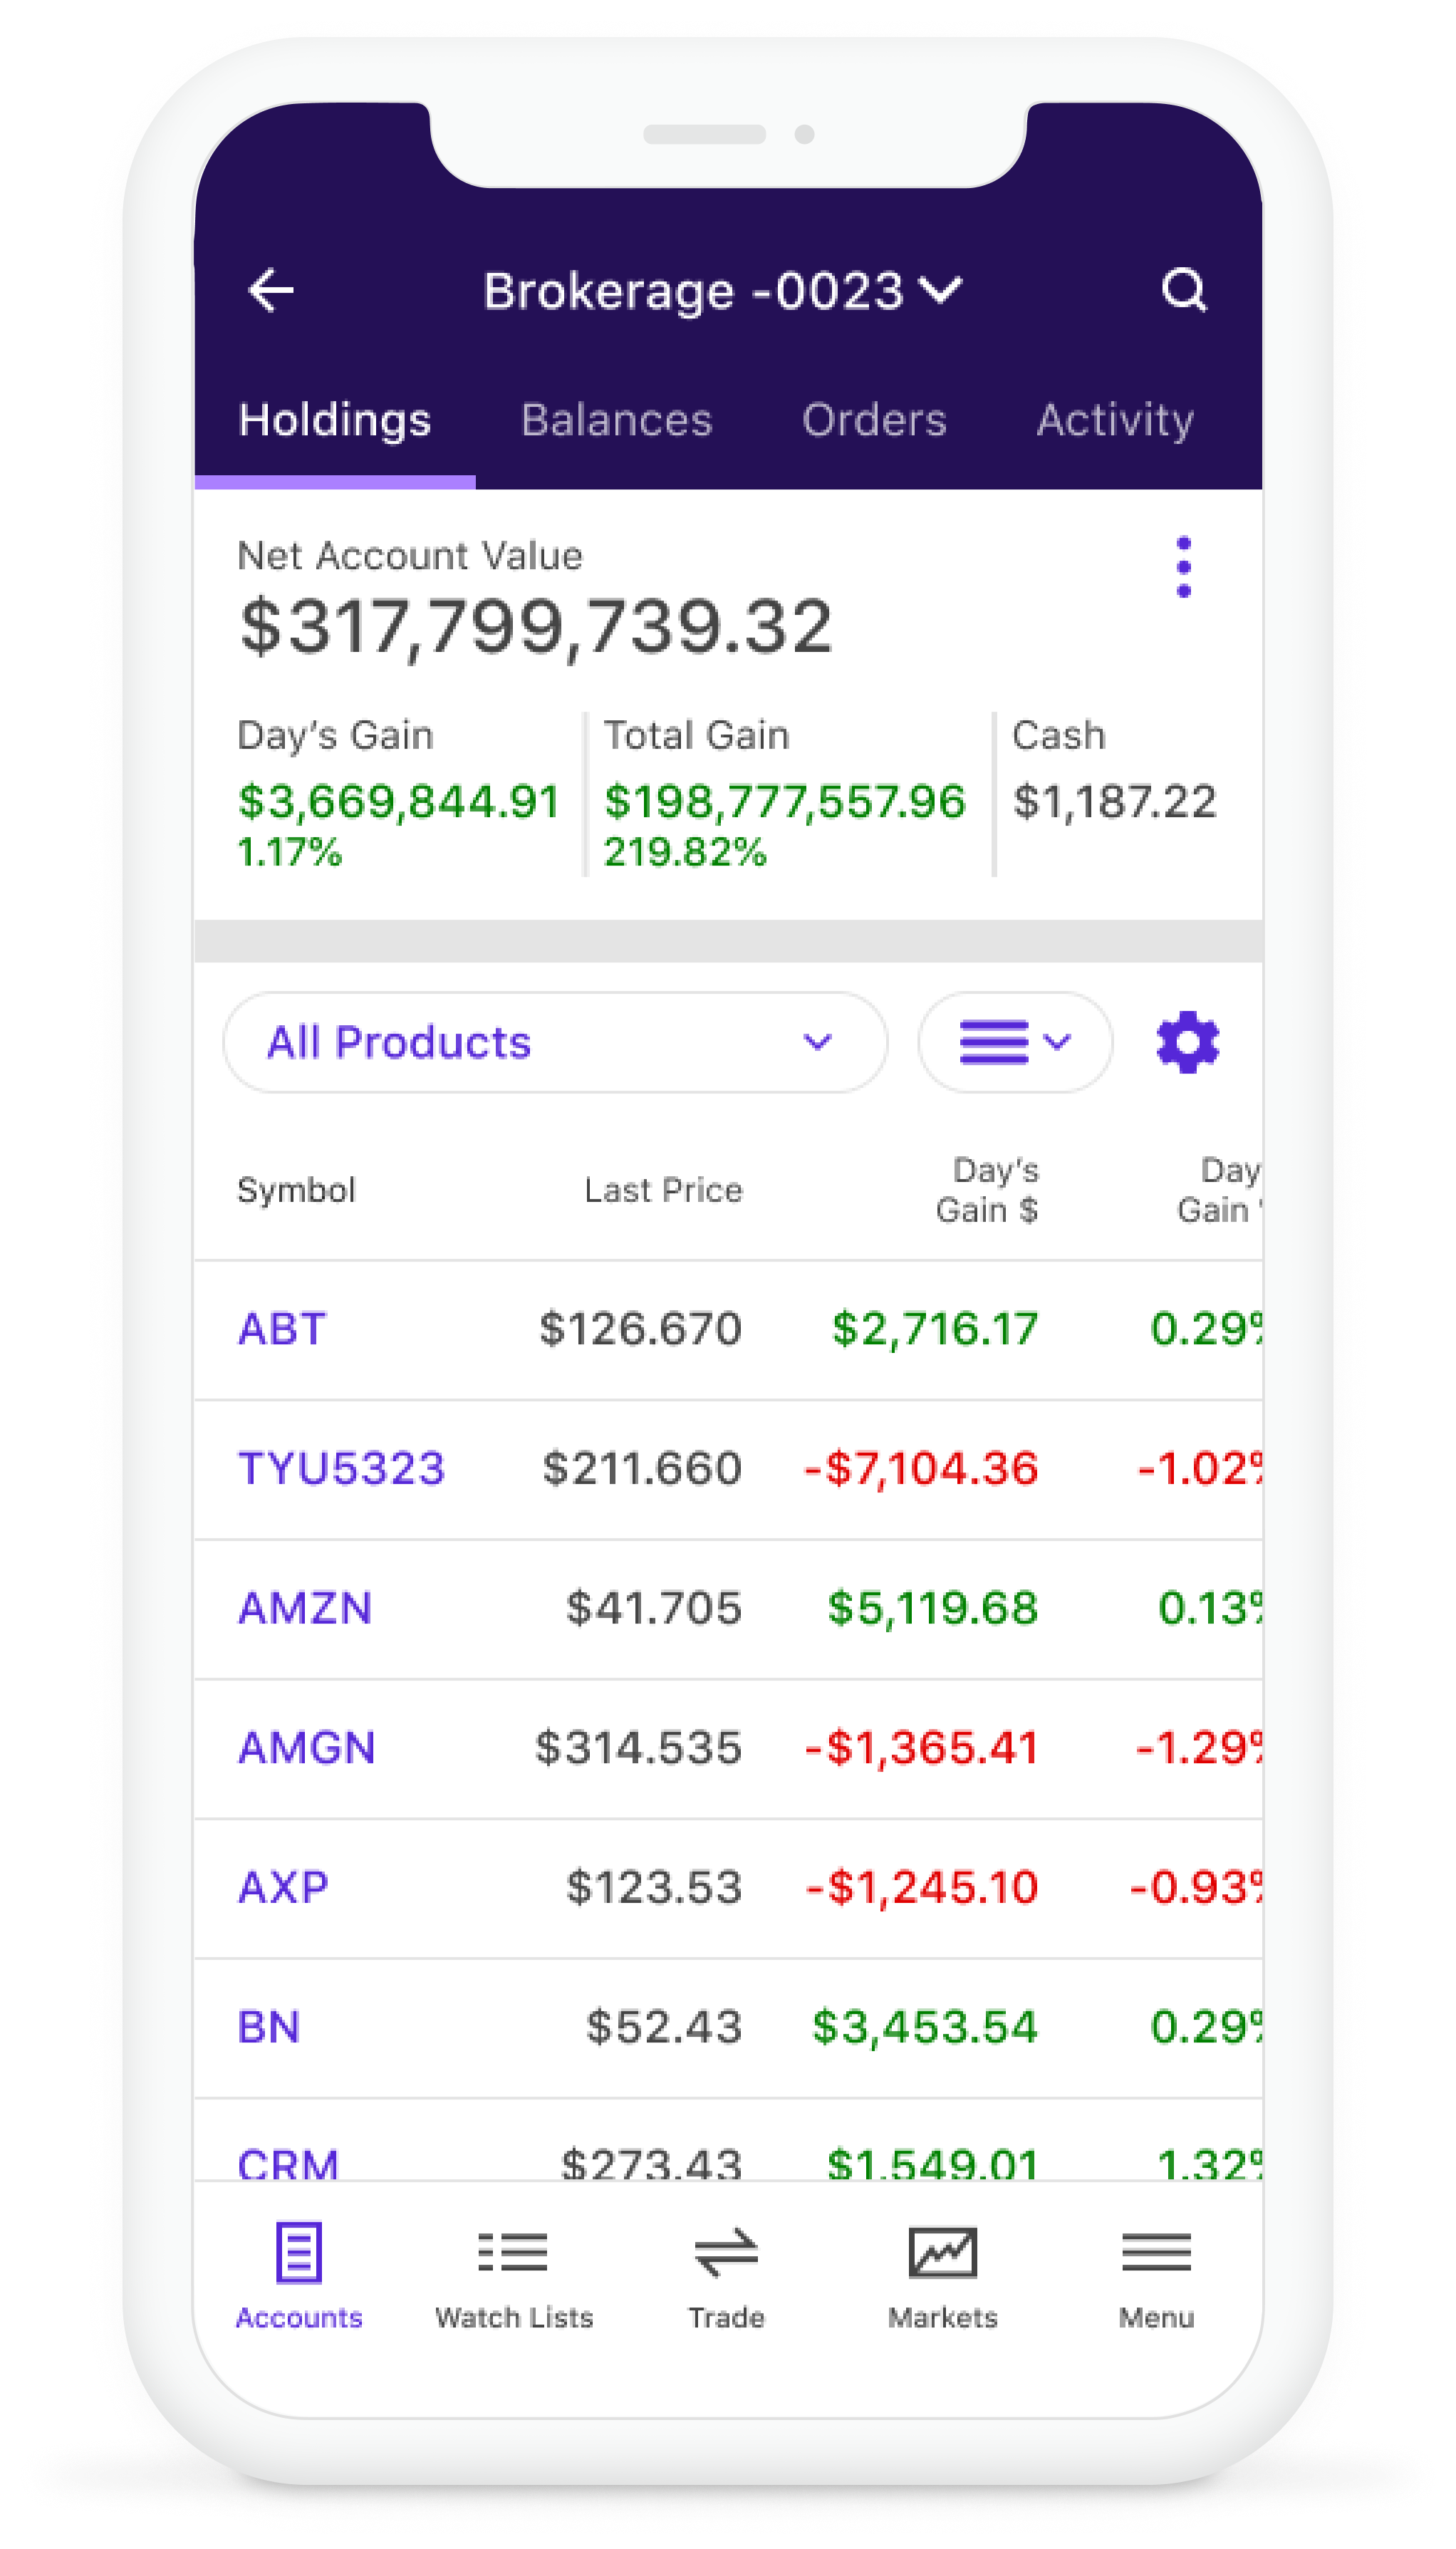
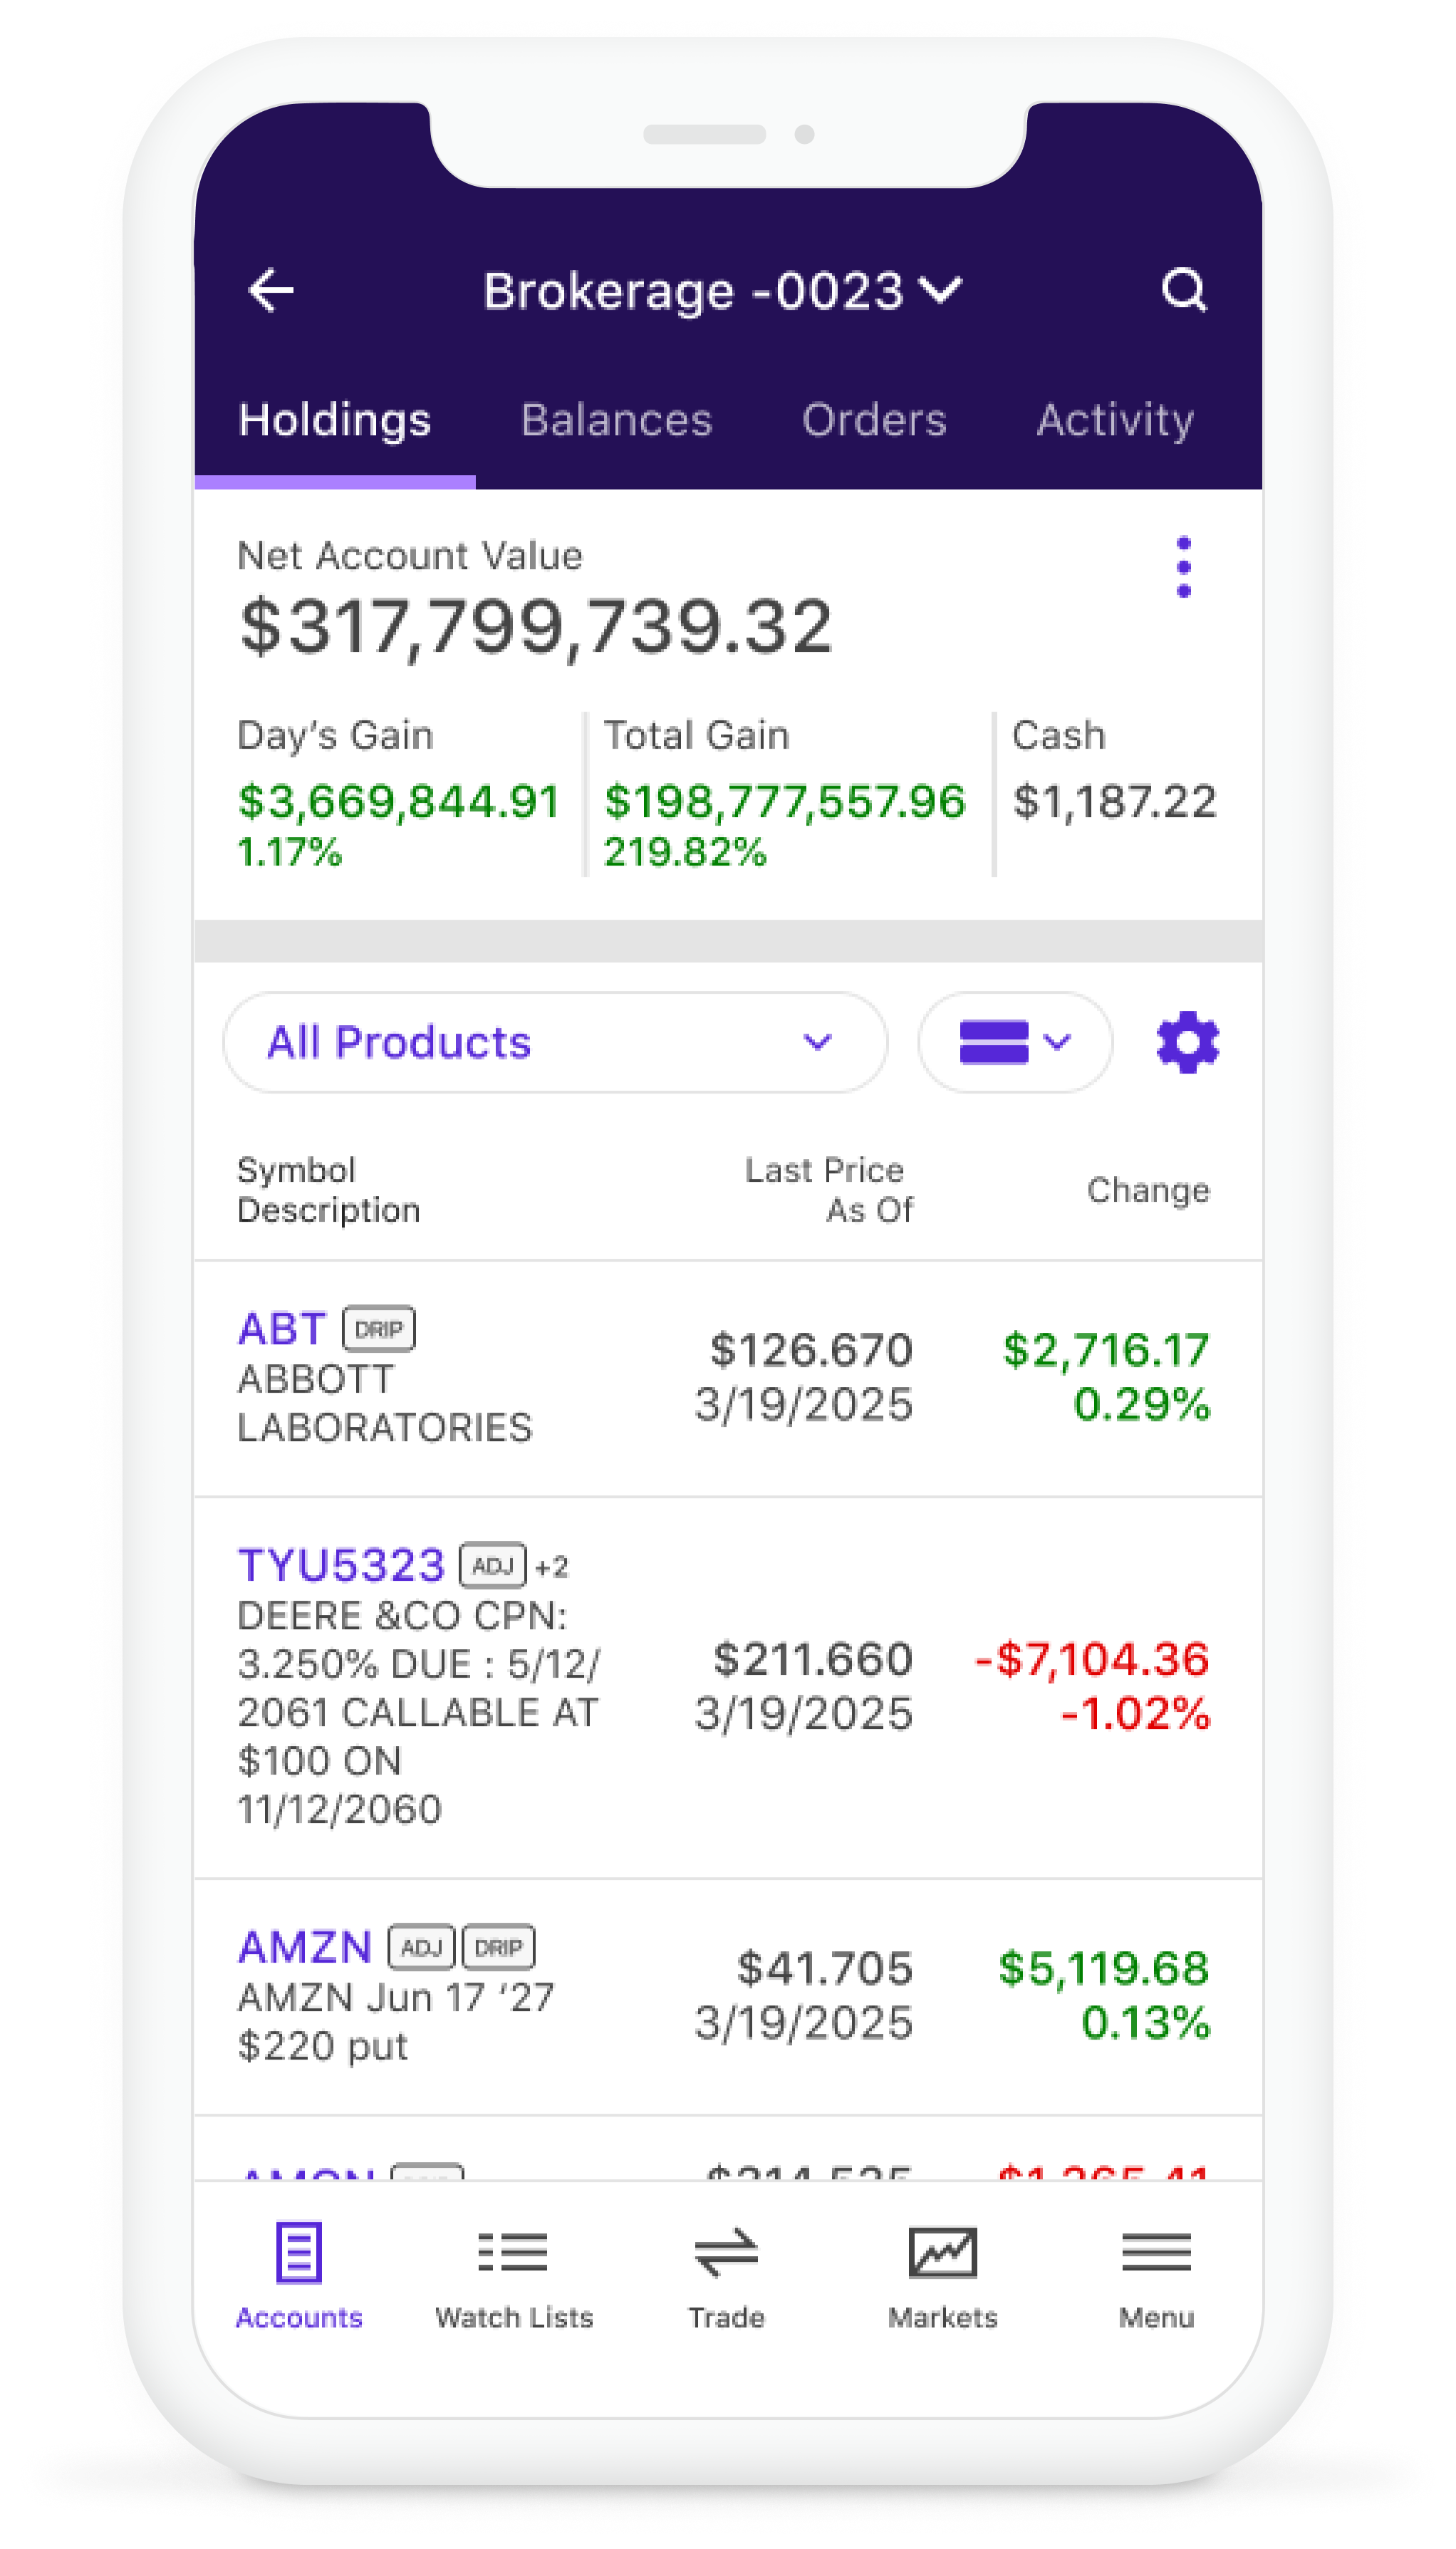
This compact vs expanded approach was tested and proved to be successful.
Deliver
Strategic wrap-up
When delivering the final designs, we outlined how the Holdings experience had changed for both ET and MS clients.


Design delivery
In addition to our base cases, we delivered designs for edge cases and a functional prototype.

Next steps
The web Holdings experience is currently in development and is set to be released in early 2026.
The mobile version is still a WIP as we finalize sequencing with our web counterparts.